

Users say checkout is broken. How long until your team knows why?
The honest answer depends on how far up the observability ladder the team has climbed. Think of it as a simple observability maturity model with seven levels. Each one lets you see a bit more of your system, and each one closes a gap the level below leaves open.
When we assess a technology team, for an investor or for a leadership team that wants a second opinion, this ladder is one of the quickest ways to see how the team copes when something breaks. Here's each level, the gap it closes, and the question we'd ask.
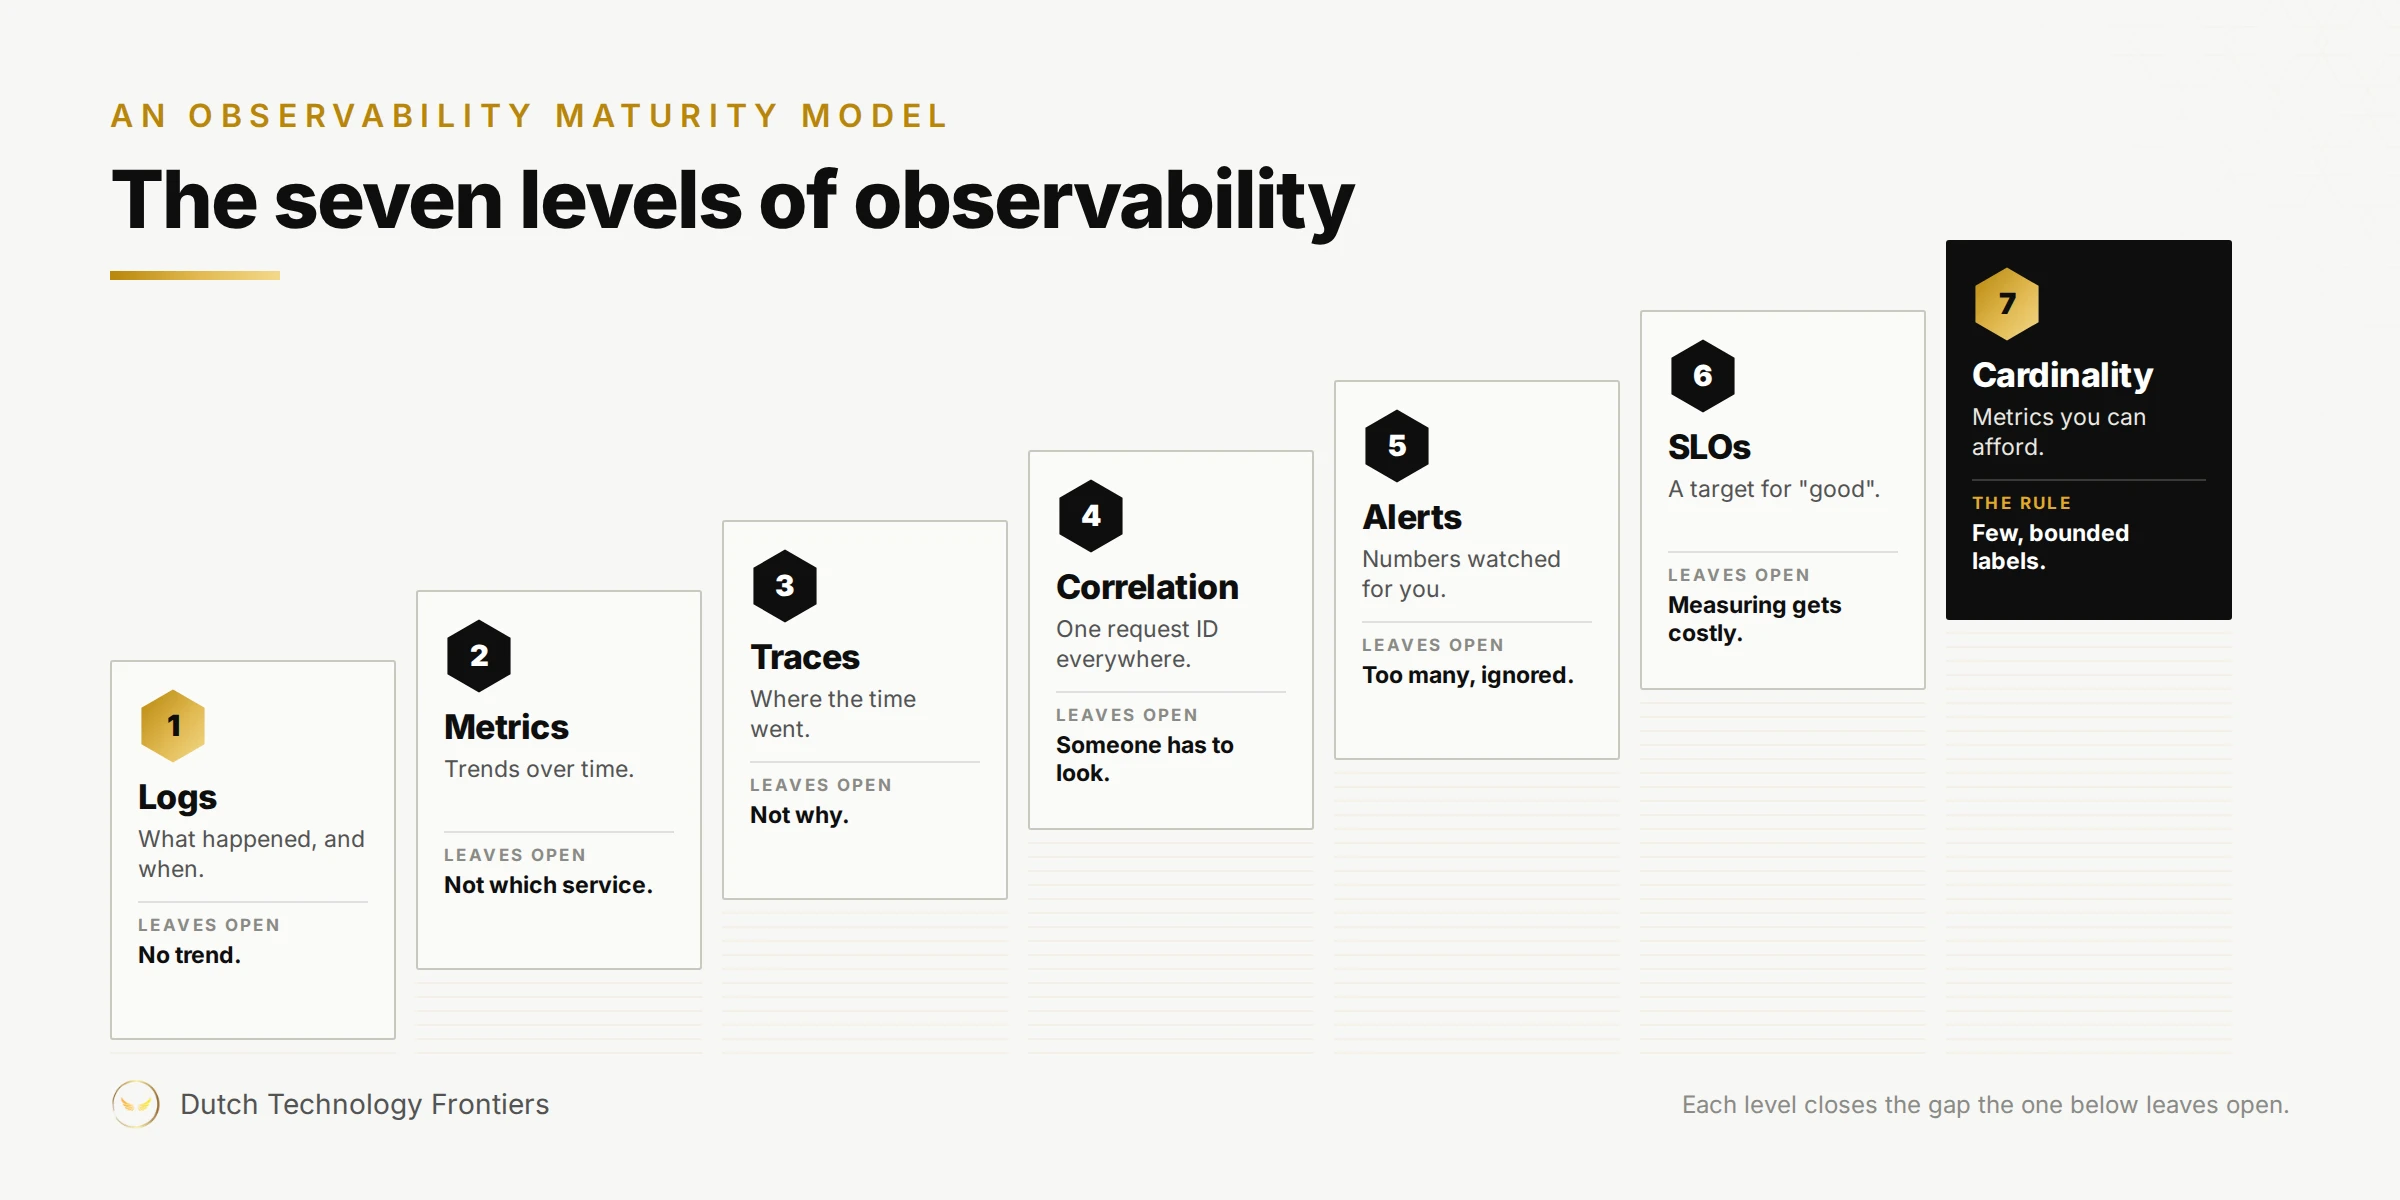
Level 1: Logs
Your app writes a line for every event: what happened, and exactly when. Every team starts here.
One line tells you a payment timed out at 10:24:33. It can't tell you whether that's a one-off or the start of a trend.
Ask: Are logs structured and searchable in one place, or does someone log into servers to read them?
Level 2: Metrics
Metrics are numbers your app reports every few seconds: requests per second, the error rate, and how long each request takes. Put them on a dashboard and you see the trend. Checkout is getting slower.
Watch the slow end, like the 95th percentile, not the average. An average hides your unhappiest customers.
But checkout touches five services. Which one is slow?
Ask: Is there a dashboard for the journeys that make money, and does anyone look at it when nothing is wrong?
Level 3: Traces
A trace follows one request through every service and times each step. Gateway 15 ms, auth 30 ms, orders 80 ms, payments 120 ms, database 800 ms. Now you know where the time went.
You still don't know why.
Ask: Can the team follow a single request end to end, across every service it touches?
Level 4: Correlation
Give every request an ID the moment it arrives. Every service stamps that ID on its logs and traces, and passes it on to the next service. There's a web standard for this, the W3C traceparent header, so it works across tools.
Now search that ID and the logs tell you why: a database query with no index.
This is the level where logs, metrics and traces stop being three tools and become one picture.
Ask: From an alert, how many clicks does it take to reach the log line that explains it?
Level 5: Alerts
So far, someone only looked because users complained. An alert watches the numbers for you. Errors above 5% for five minutes, and the on-call phone rings before most users notice.
Collecting signals isn't the same as acting on them. When an AI agent got into Hugging Face's systems in July, its monitoring pulled the signals together but didn't rate them severe enough to page anyone, and that cost time. We covered that case in AI agents got into real companies' systems this year.
Ask: For the last three incidents, who found out first: the team or the customers?
Level 6: SLOs
Alert on every blip and the team learns to ignore alerts. So decide what "good" means, and measure that.
SLI is what you measure, such as the share of checkout requests that succeed quickly enough.
SLO is your target for it, such as 99.9% over 30 days. That leaves an error budget of about 43 minutes a month.
SLA is what you promise customers, with credits or penalties if you miss it.
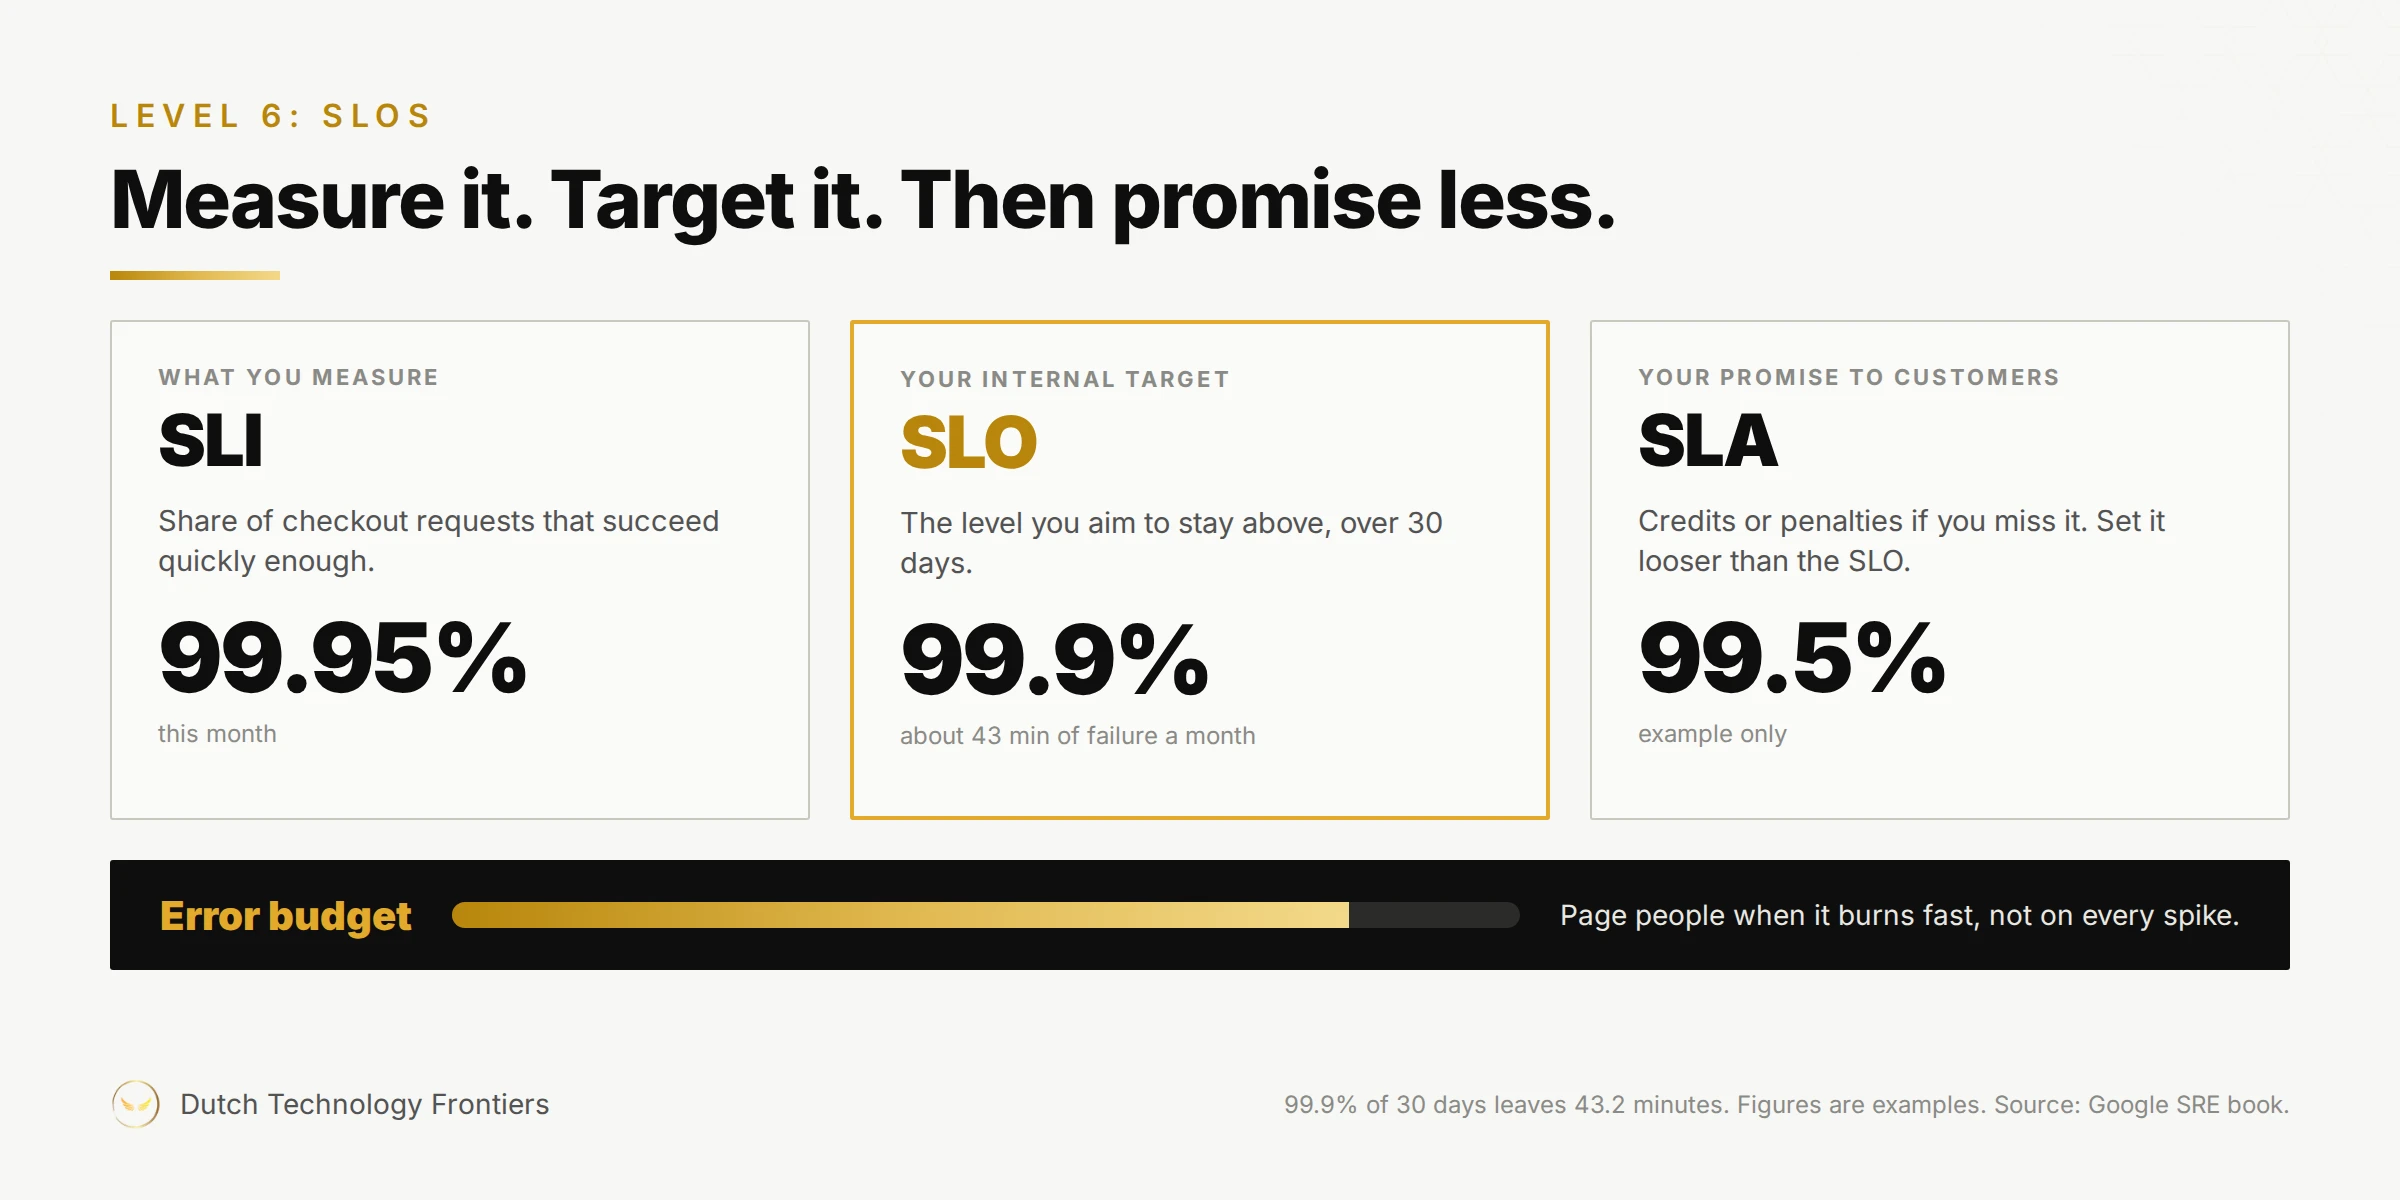
Two things matter here. Page people when the error budget is burning fast enough to threaten the target, not on every spike. And keep the promise in the contract looser than the internal target, so there's room to fix problems before they cost money.
Ask: Is there a written SLO for the main customer journey, and do the SLAs in customer contracts match what the system actually delivers?
Level 7: Cardinality
This is the boss level. Once a team can see, it wants to measure everything. So someone adds the user ID as a label on a metric.
Every unique combination of label values becomes a separate time series. A million users turns one series into a million. Storage, query speed and the monitoring bill all get worse together, and hosted tools often bill by that count.
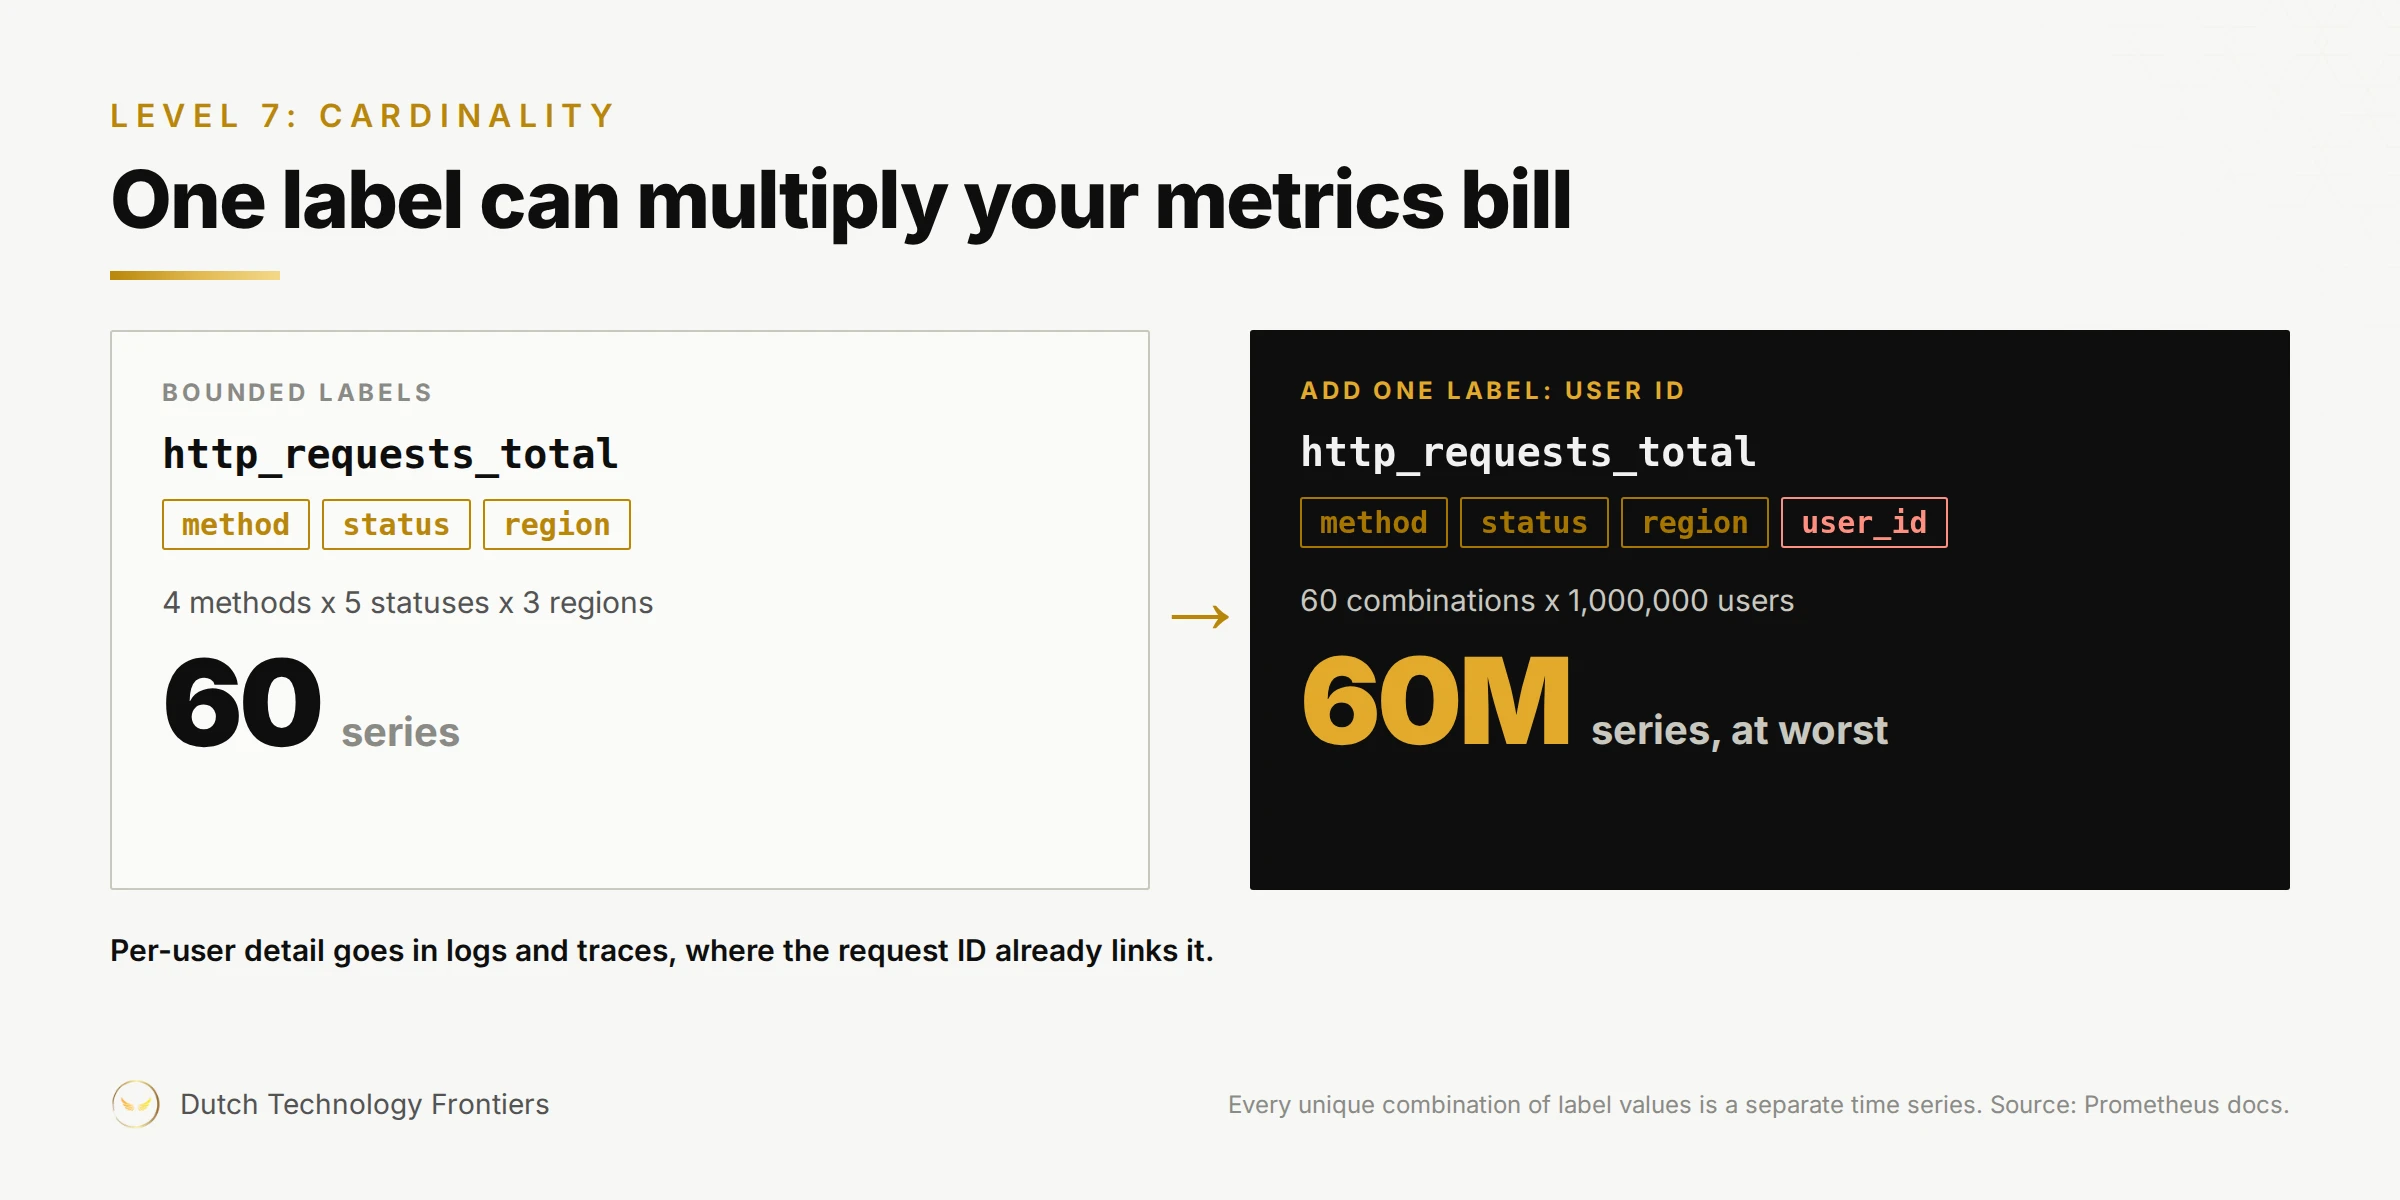
The fix is a rule, not a tool. Keep metric labels few and bounded, like method, status and region. Per-user detail belongs in logs and traces, where the request ID from level 4 already connects it.
Ask: What does monitoring cost each month, and is that growing faster than traffic?
Where does your team sit?
Skipping levels rarely works. Alerts without metrics have nothing to watch. SLOs without traces tell you you're failing, but not where. A team that hits the cardinality problem before it has correlation ends up with a big bill and still can't explain an outage.
If you're investing in a software business, buying one or running one, the seven questions above don't take long to answer, and the answers say a lot about how the next outage will go. They're also part of what we look at in a technology due diligence.
FAQ
What is an observability maturity model?
A way to describe how well a team can see what its systems are doing, in stages. This one has seven levels: logs, metrics, traces, correlation, alerts, SLOs and cardinality control. Each level answers a question the one below can't.
What's the difference between monitoring and observability?
Monitoring tells you something is wrong, usually by watching numbers you chose in advance. Observability is being able to work out why, including for problems nobody predicted. In practice it needs logs, metrics and traces tied together by a shared request ID.
What's the difference between an SLI, an SLO and an SLA?
An SLI is the measurement, such as the share of requests that succeed. An SLO is the internal target for it, such as 99.9% over 30 days. An SLA is the promise to customers, with consequences if it's missed, and it should be looser than the SLO.
What is high cardinality in metrics?
It's when a metric label can take a huge number of values, such as user IDs or email addresses. Every unique combination of labels is stored as its own time series, so storage and cost grow fast. Keep that kind of detail in logs and traces instead.
Talk to us
If you'd like an outside view on where your team sits, talk to Dutch Technology Frontiers.